Projects
Selected public projects, each with a stable landing page and a bit of context.
Source code lives on GitHub; this page highlights the few projects worth a stable landing point and a bit of context — not a complete inventory of everything I’ve built.
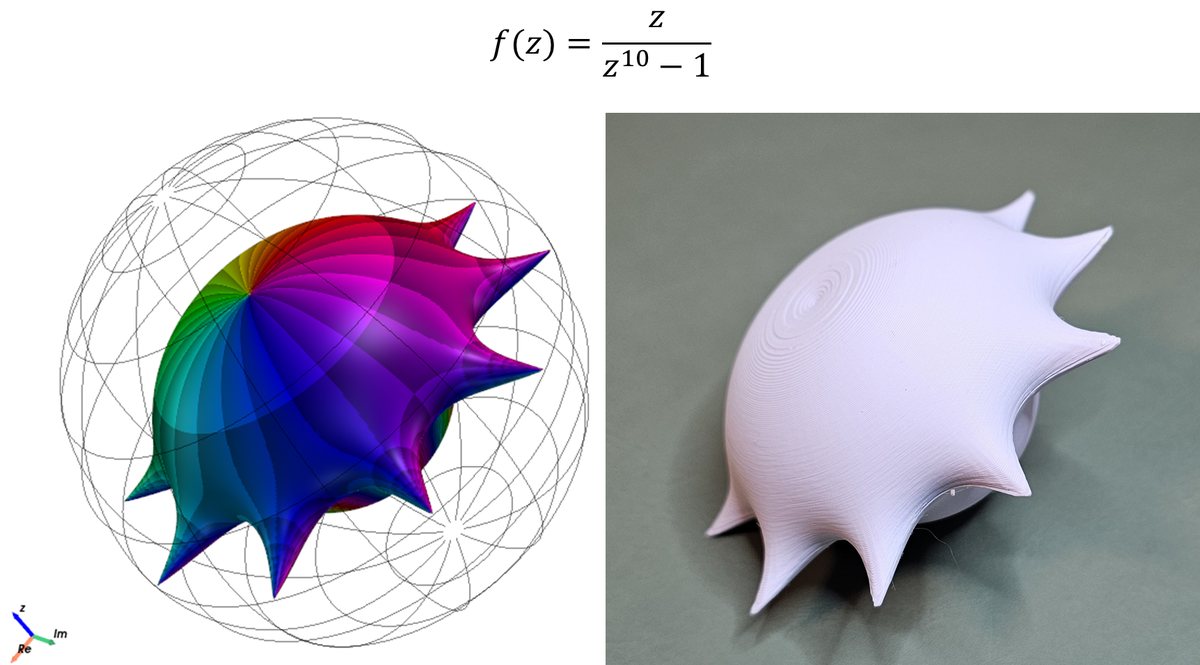
A Python library for visualizing complex functions — phase portraits, 3D landscapes, the Riemann sphere, Riemann surfaces, and STL export to 3D-printable mathematical ornaments. On PyPI.
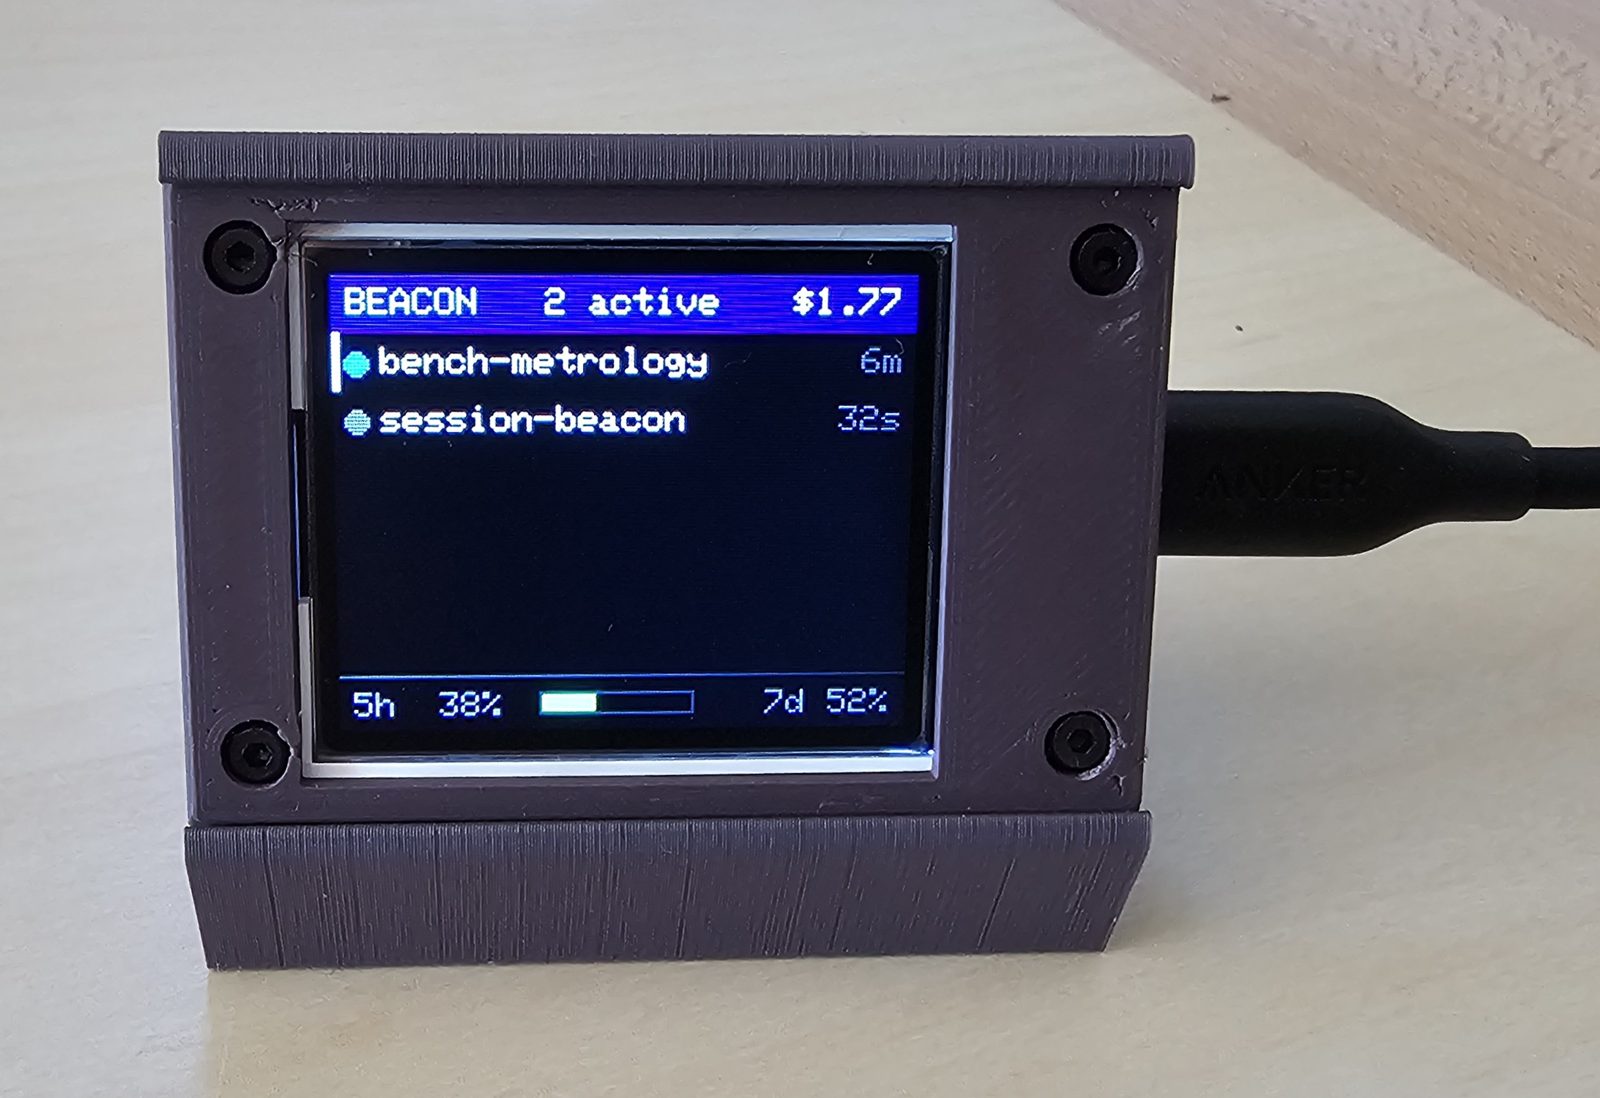
A small USB desktop display for parallel Claude Code sessions — which are working, which are idle, and which are waiting on a permission prompt.
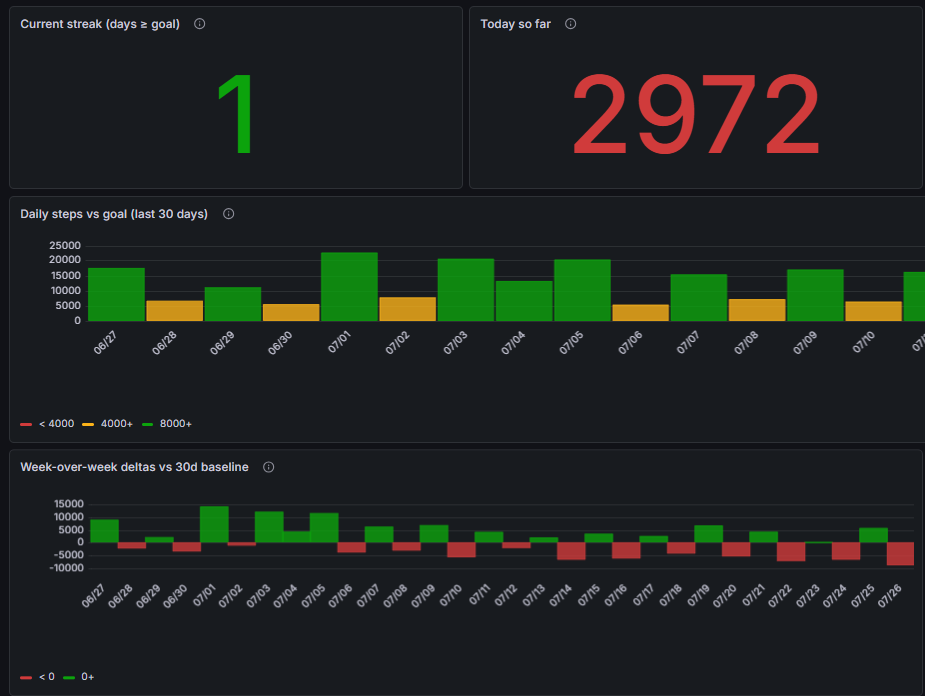
A self-hosted TimescaleDB warehouse for health, activity, environmental, and hardware-telemetry data — backfilled from exports, kept current by small monitored pollers, and dashboarded in Grafana.
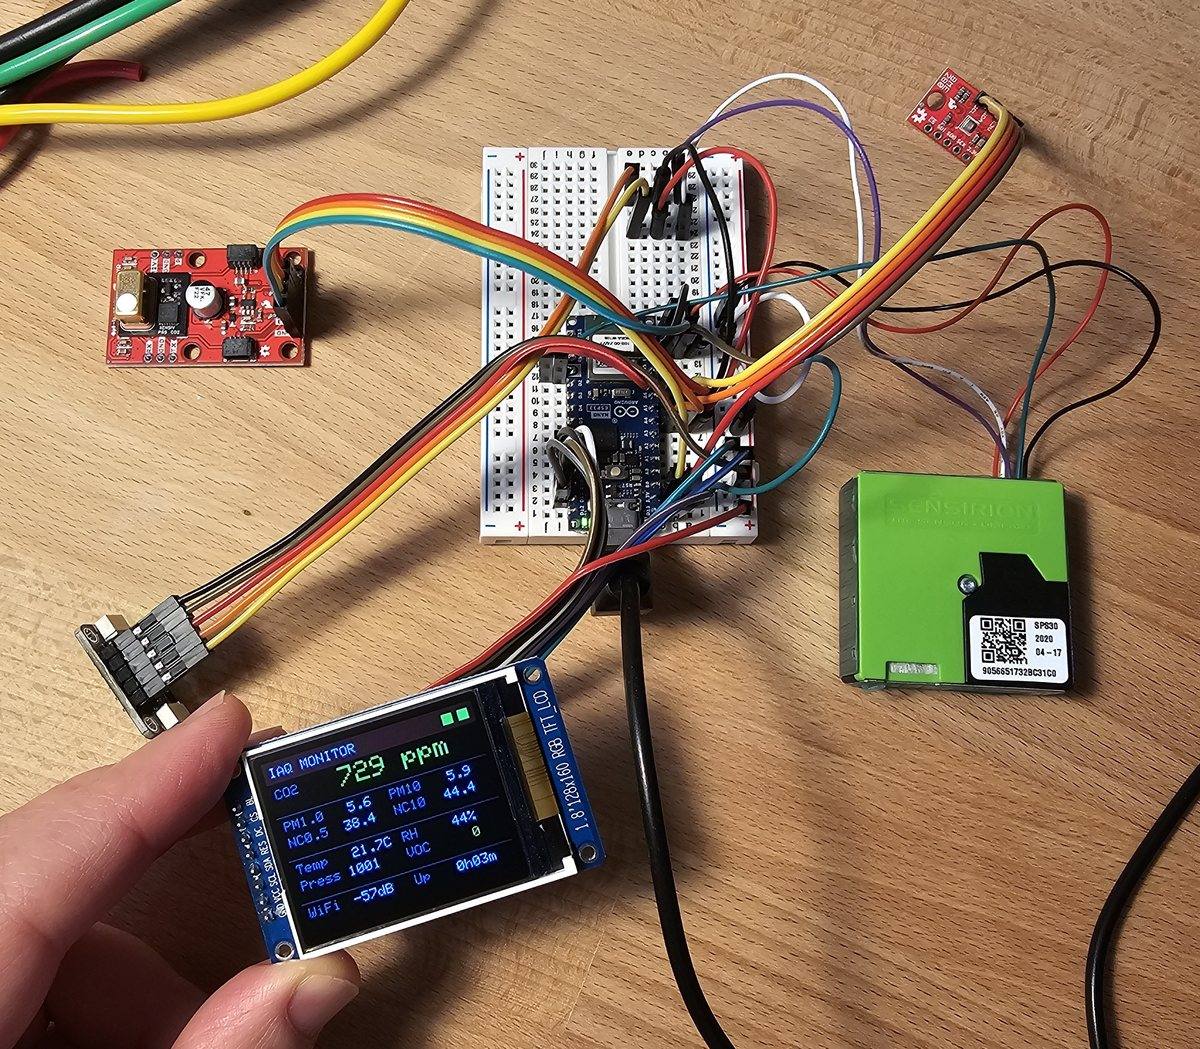
A full-stack IoT air-quality monitor: ESP32 firmware reading four I²C sensors, MQTT into TimescaleDB, and Grafana dashboards — all Dockerized on a Raspberry Pi.
No matching items