Air-Quality Monitoring System
The build runs end to end: an Arduino Nano ESP32 reads four I²C sensors — CO₂ (Infineon XENSIV PAS), particulate matter (Sensirion SPS30), temperature/humidity/pressure (Bosch BME280), and VOC (Sensirion SGP40) — and shows a color-coded live view on a small TFT display. Readings travel over MQTT to a Dockerized backend where they land in TimescaleDB; outdoor readings come from a PurpleAir node polled through its API, with EPA-corrected PM2.5 for honest indoor-versus-outdoor comparisons.
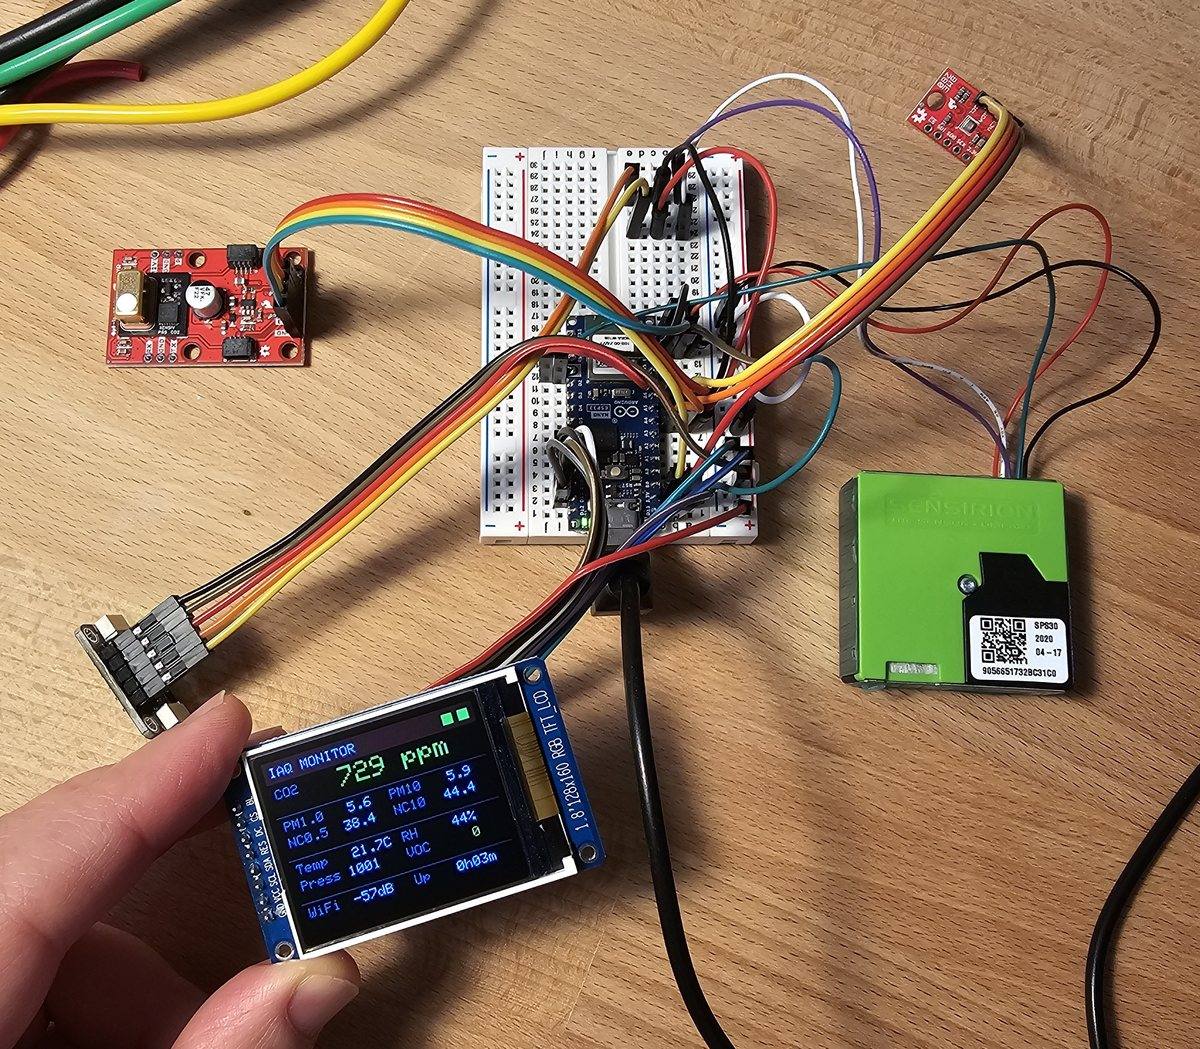
Design notes:
- Non-blocking firmware — each sensor polls on its own interval, with ring-buffer averaging to tame noisy readings.
- Reproducible backend — Mosquitto, ingestion, TimescaleDB, and Grafana are composed with Docker, including auto-provisioned dashboards.
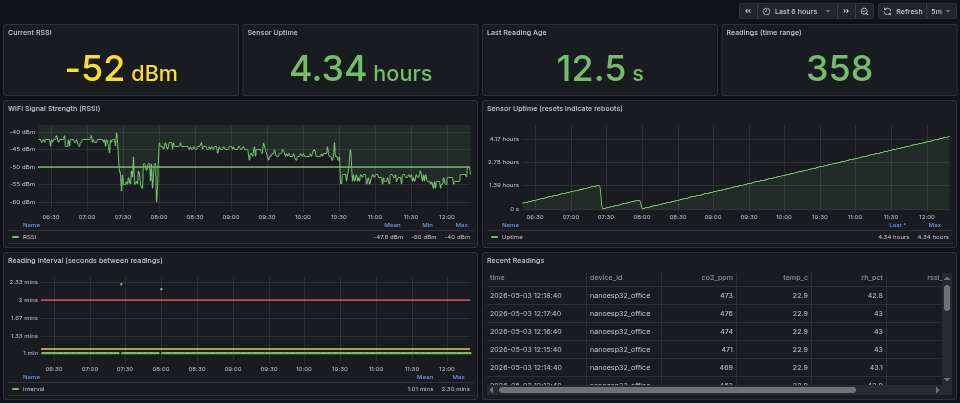
- Data-quality monitoring — Wi-Fi signal strength, sensor uptime, and reading intervals are tracked alongside the measurements themselves.
Architecture
The system splits cleanly into a microcontroller edge node and a Dockerized backend on a Raspberry Pi, joined by MQTT. The PurpleAir feed enters on the backend side, through its own ingest service.
The diagram shows the original single-host build, which stands on its own — TimescaleDB runs on the Pi alongside the rest of the stack, and that is how the system started. On my own deployment the database has since moved onto a NAS as part of a shared self-hosted cluster, where the environmental readings sit alongside health, activity, and hardware-telemetry data on a common time axis. Where the database lives is a deployment choice; the ingest path is the same either way.
Dashboards
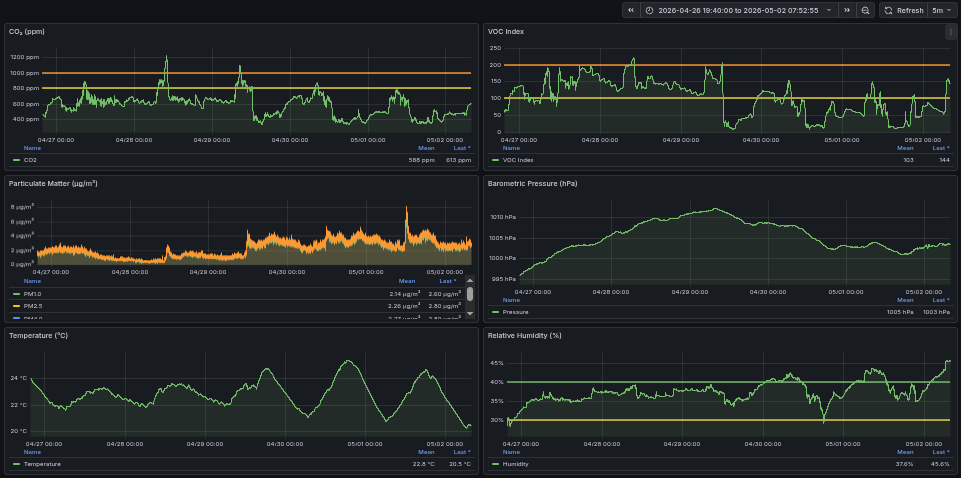
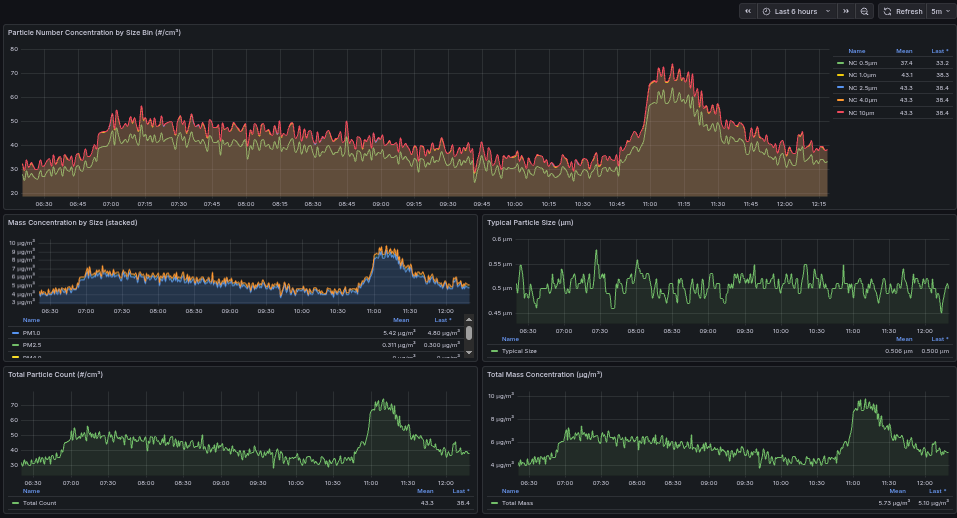
Grafana auto-provisions four views — an overview, a particulate-matter deep dive, a data-quality monitor, and an indoor-versus-outdoor comparison.
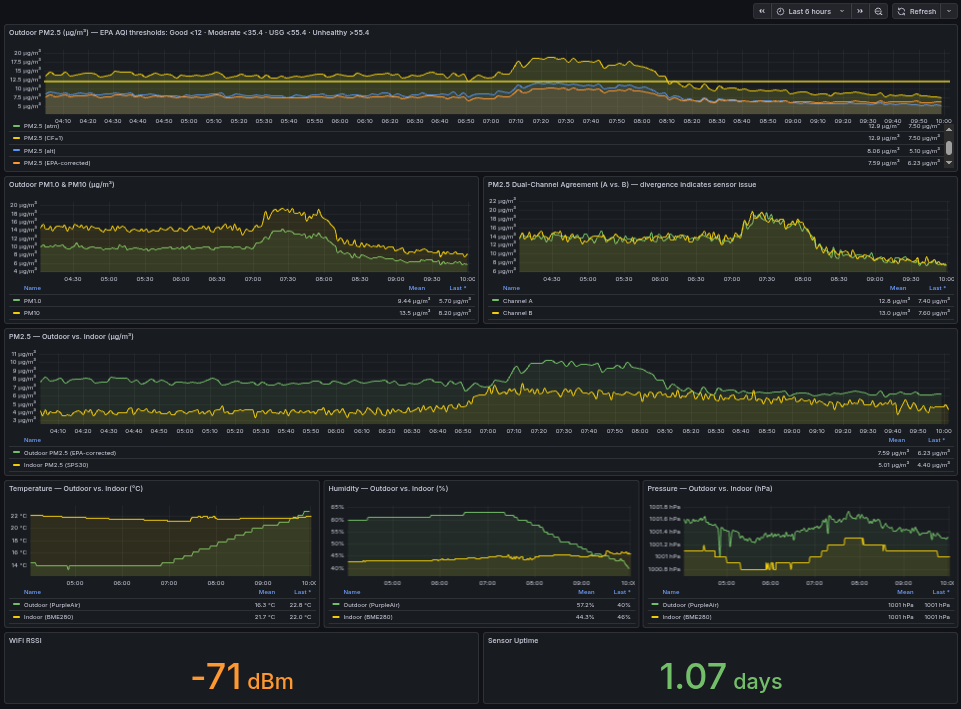
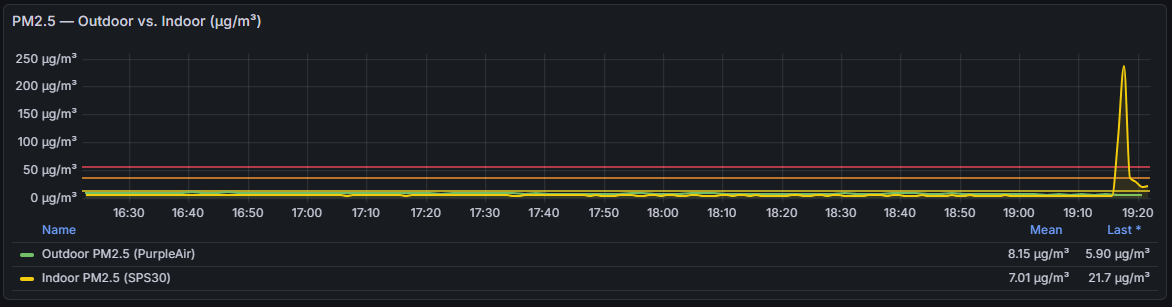
A monitor is only as good as the moments it catches — here the PM2.5 trace spiking during an evening of soldering, then clearing once ventilation kicks in.